
 MENU
MENU Variance reduction with neighborhood smoothing for local intrinsic dimension estimation
Abstract
Local intrinsic dimension estimation has been shown to be useful for many tasks such as image segmentation, anomaly detection, and de-biasing global dimension estimates. Of particular concern with local dimension estimation algorithms is the high variance for high dimensions, leading to points which lie on the same manifold estimating at different dimensions. We propose adding adaptive `neighborhood smoothing’ – filtering over the generated dimension estimates to obtain the most probable estimate for each sample – as a method to reduce variance and increase algorithm accuracy. We present a method for defining neighborhoods using a geodesic distance, which constricts each neighborhood to the manifold of concern, and prevents smoothing over intersecting manifolds of differing dimension. Finally, we illustrate the benefits of neighborhood smoothing on synthetic data sets as well as towards diagnosing anomalies in router networks.
Paper
Kevin M. Carter and Alfred O. Hero III, “Variance reduction with neighborhood smoothing for local intrinsic dimension estimation,” in Proc. of 2008 IEEE International Conference on Acoustics, Speech, and Signal Processing, Las Vegas, NV., March 2008. (.pdf)
Matlab Code
Download (.zip)
Figures
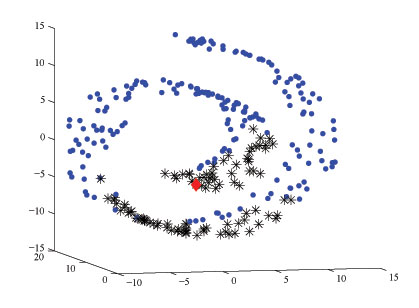
Figure 1a. Points in neighborhood (*) defined by Euclidean distance of a specific sample (diamond). This forms spherical neighborhoods.
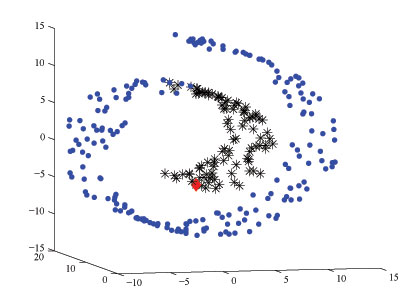
Figure 1b. Points in neighborhood (*) defined by geodesic distance of a specific sample (diamond). Notice this forms neighborhoods which adapt to the manifold.
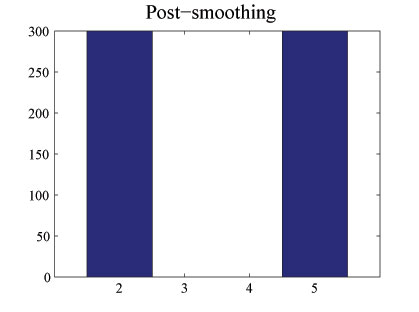
Figure 2a. Local dimension estimates for a 7-dimensional data set consisting of one 5-dimensional and one 2-dimensional hypersphere which intersect. Histogram shown before neighborhood smoothing.
Figure 2b. Local dimension estimates of the above data set after neighborhood smoothing.
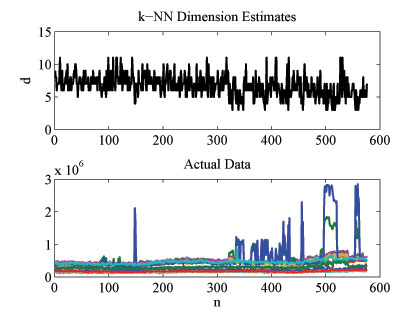
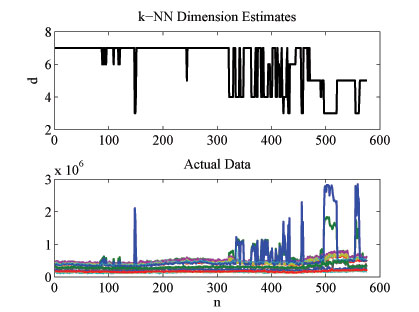
Figure 3a. Local dimension estimates for Abilene router data before smoothing.
Figure 3b. Local dimension estimates for Abilene router data after smoothing. Notice how visual analysis is much easier while anomalous activity is still preserved.
Comments and Remarks
